
A client or business leader comes to you with a goal of optimizing their website to improve conversion rate and drive more revenue. They have a lot of ideas of their own, including a variety of inputs from both product, creative, and merchandising teams. Optimizing the website should be easy with these great ideas, right? Not so fast. Part of the art of a successful Conversion Optimization program is being able to successfully prioritize optimization ideas to ensure you remain focused on the things that are likely to move the needle and improve the digital experience for your customers.
The Optimization Opportunity
Enter Conversion Optimization research. The research phase of a Conversion Optimization program is critical to ensuring that your program will be successful. Without the research, you’re just guessing – and often relying on internal biases – when it comes to creating your optimization roadmap.
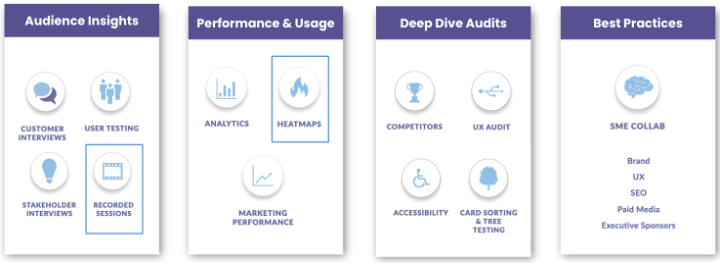
There are a wide variety of optimization research tactics. We’ll focus on Recorded Sessions and Heatmaps here.
What are Heatmaps & Session Recordings?
According to Hotjar, a heatmap is a graphical representation of data where values are depicted by color. By aggregating user behavior, heatmaps give a snapshot understanding of how your audience interacts with your web page. Heatmaps make it easy to visualize complex data and understand it at a glance.
Session recordings show the step-by-step actions your visitors are taking while they are on your website. The recordings show clicks, taps, scrolling, and mouse movement across pages as the visitor is browsing your website.
How to Use Heatmaps & Session Recordings to Fuel an Optimization Roadmap
- Visualize the popular (hot) and unpopular (cold) elements of a web page
- Understand what content users are seeing and engaging with (and what they’re not seeing or engaging with)
- See where users are experiencing friction or dropping out of the site funnel
- Understand how users are scrolling across a given page, and if they are interacting with your page’s interactive elements
- Supply data and insights to inform a hypothesis to answer critical questions
- Uncover and prioritize bugs or display issues across devices.
- Put yourself in your visitor’s shoes.
The Step-by-Step Process
But how exactly can you use these types of tools to inform your optimization efforts? This is the step-by-step process we typically use at Adept for these types of analyses:
Step 1: Collect Data
During this step, you will set up and configure your tool to start collecting data.
- Choose a Heatmapping & Session Recording Tool
- Install the tracking code on your website
- Filter out internal traffic to ensure you’re analyzing your real visitors, not your colleagues
- Define targeting & capturing to maximize relevancy.
- Collect data for 30-days (depending on traffic volume) before beginning analysis
Step 2: Define Your Research Questions
To be efficient and ensure that the analysis is going to be productive, make sure you have a defined research question or questions.
- What are you trying to learn?
- Make questions as focused as possible. Too wide of a focus will lead to inefficient analysis
- If asking two or more questions, test each in isolation
- Example Research Questions:
- Which button copy performs best?
- Are visitors seeing the important content on PDPs?
- When users reach a landing page, what do they do next?
Step 3: Analyze Heatmaps
- Are users seeing your critical content? Is it above the fold or are they scrolling to it?
- Are they clicking on your primary CTAs or links? Or are they trying to click non-interactive elements?
- Are visitors distracted by content that isn’t important to your (or their) business goals?
Step 4: Watch recorded sessions
- Filter sessions focused solely on the research question at hand
- Look for:
- How long users spend on content, and if they scroll back and forth between content
- How users are navigating between pages
- How (and when) they interact with CTAs
- Unusual mouse movements or interactions
- When users drop out of your funnel
- Take notes! Record any notable insights + key takeaways
Step 5: Look for trends and hypothesize
- What trends did you find throughout the analysis?
- Were there specific places where several users experienced confusion or frustration?
- Summarize your key learnings
- Hypothesize: Based on what you learned, what improvements can be made to improve the site experience?
Engagement analysis in practice
So, what does this look like in real life? Here are some examples where we used actual heatmaps and session recordings as inputs to optimization roadmaps.
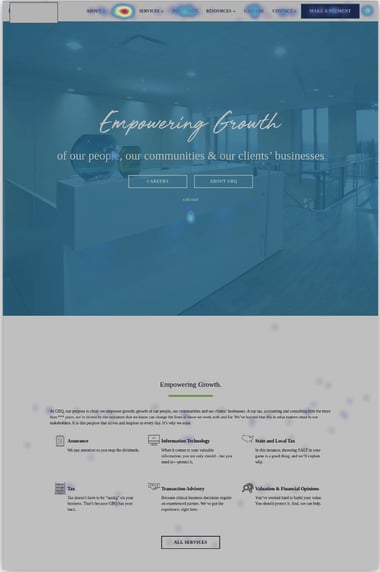
 Example 1
What we see from the heatmap:
- Users are rarely scrolling below the hero image of this page
Insight:
- Valuable homepage real estate is not engaging customers outside of the header navigation and hero container
- Critical information that is lower on this page is being missed
Optimization Opportunities:
- Shorten or reorganize the homepage
- A/B test messaging + imagery in the hero image to maximize engagement
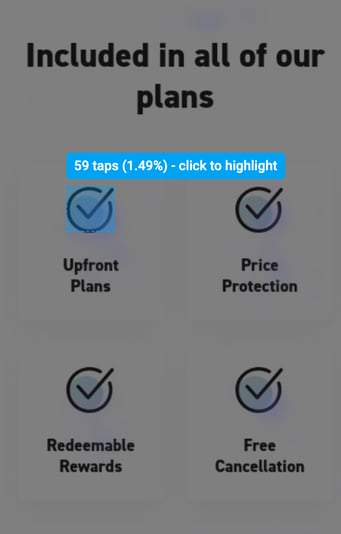
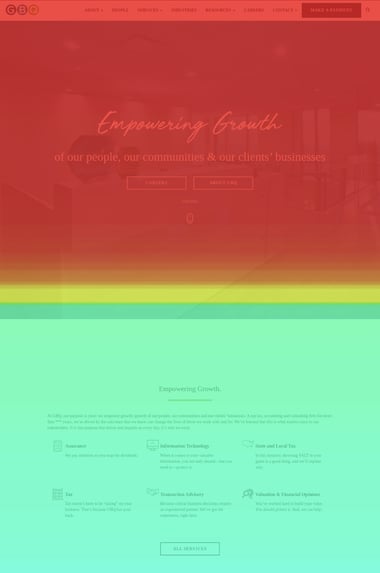
Example 2
What we see from the heatmap:
-
- Users are clicking on an area of a landing page that is not a link
Insight:
-
- Users believe this is a link, and are interested enough in it to click
Optimization Opportunities:
-
- Redesign to clarify that it is not a clickable link, or...
- Create content to support this feature, make the image clickable to access additional content
Example 3
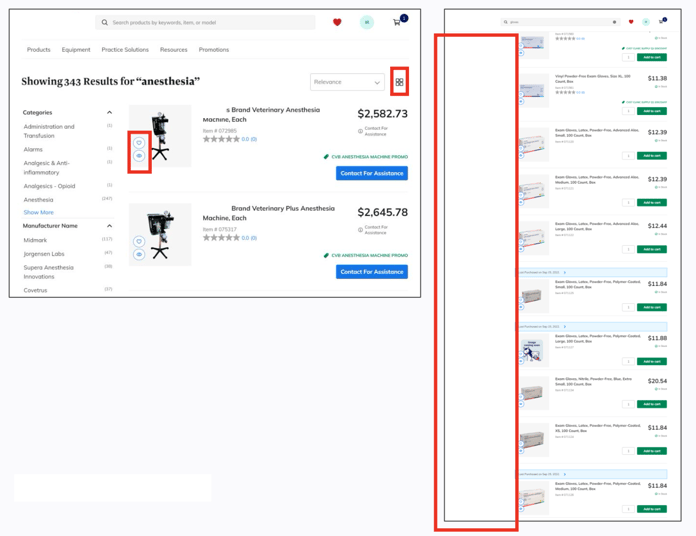
What we saw in the session recording:
- Users were not using the search refinements at the top of Search Results Pages
- They were scrolling to the bottom of the page and then searching again, if they didn’t find what they needed
Optimization Opportunity:
- Make filters & facets sticky as the user scrolls
- Add suggested refinements to the top of the SRP to enable more relevant results
- Default to grid view for visibility of more products at once to reduce scrolling
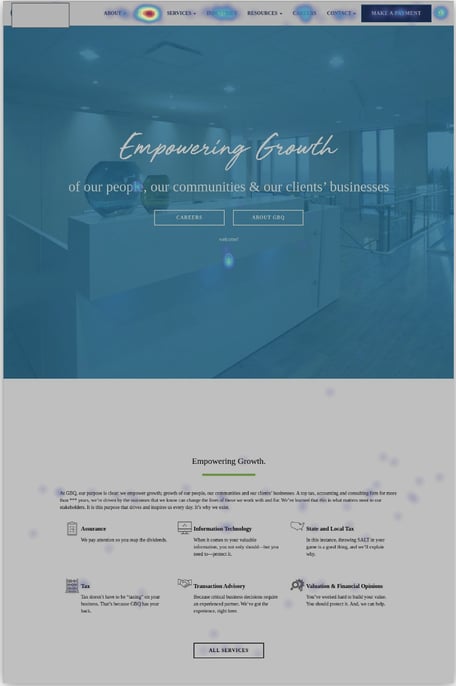
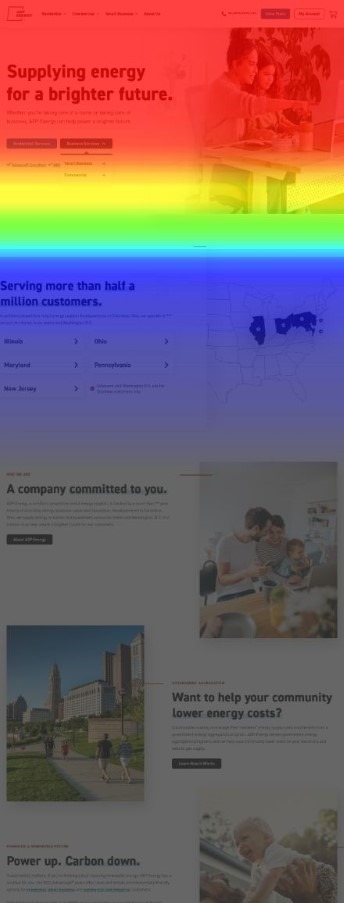
Example 4
What we see in the heatmap:
- Click Map indicates that Make a Payment button is not getting significant engagement. (This was confirmed with analytics data)
Optimization Opportunity:
- Deprioritize “Make a Payment” to a text link or link within the footer.
- Utilize the CTA button for lead generation
Heatmapping and session recording are two essential elements of any conversion optimization program. By knowing where to start and what to look for, you can make each page of your digital experience work hard and be more efficient to your end customers.
There is no such thing as a perfect landing page or digital storefront. So, hypothesize, test, analyze, implement, and repeat. A high-performing Conversion optimization program is a journey, not a destination.